
Institutional market update 4Q 2023
By: Kelly Kowalski CFA, Bronwyn Shinnick CFA and Cliff Noreen
At the beginning of 2023, the consensus amongst Wall Street economists and strategists was an imminent U.S. recession to be triggered by the economy finally buckling under the weight of higher interest rates and the end of government pandemic support programs. Instead, the bears went hungry this year, and the bulls dominated in the fourth quarter. U.S. equities were projected to have a dismal year, and bonds were favored by many strategists. China was the region favored by consensus, with strong growth forecasted as the country was to emerge from COVID lockdowns. The Fed was expected to begin cutting interest rates by the third quarter as the U.S. economy contracted. In sharp contrast, the U.S. economy grew nearly 5 percent in the third quarter, and interest rates soared to their highest levels in decades. China disappointed, with Chinese equity markets underperforming, while American exceptionalism remained an investment theme throughout 2023.
Most U.S. equity indices more than erased their 2022 slides. The S&P 500 returned 26 percent on the year and the NASDAQ returned a whopping 45 percent, its best year since 1999 as continued economic momentum and an artificial-intelligence frenzy drove technology shares to outsized gains. Similarly, bonds were tracking toward another disappointing year, but began a sharp rally at the end of October as the Fed signaled both an end to its interest rate hiking cycle and multiple interest rate cuts on the docket for 2024. Financial conditions eased considerably as Treasury yields plummeted and corporate credit spreads dropped to their lowest levels since the beginning of the Fed’s tightening cycle. As a result, the fourth quarter saw a broadening out of strength beyond the “Magnificent Seven” companies (Amazon, Apple, Alphabet, Meta, Microsoft, Nvidia, and Tesla) that drove much of U.S. equity market returns through the first three quarters of the year.
An outstanding year for asset returns came despite intensified geopolitical and political uncertainty. A horrific terrorist attack in Israel on October 7th and continued conflicts in the Middle East have led to many questions regarding implications for oil and the risk of broader conflict. Russia’s war on Ukraine remains in a stalemate. A lack of U.S. fiscal responsibility and growing deficit and debt have resulted in the U.S. having to issue more Treasury debt, putting upward pressure on interest rates. U.S. debt crossed the $34 trillion threshold in the first few days of 2024. Lastly, 2024 will bring another U.S. presidential election with political polarization remaining at troubling extremes.

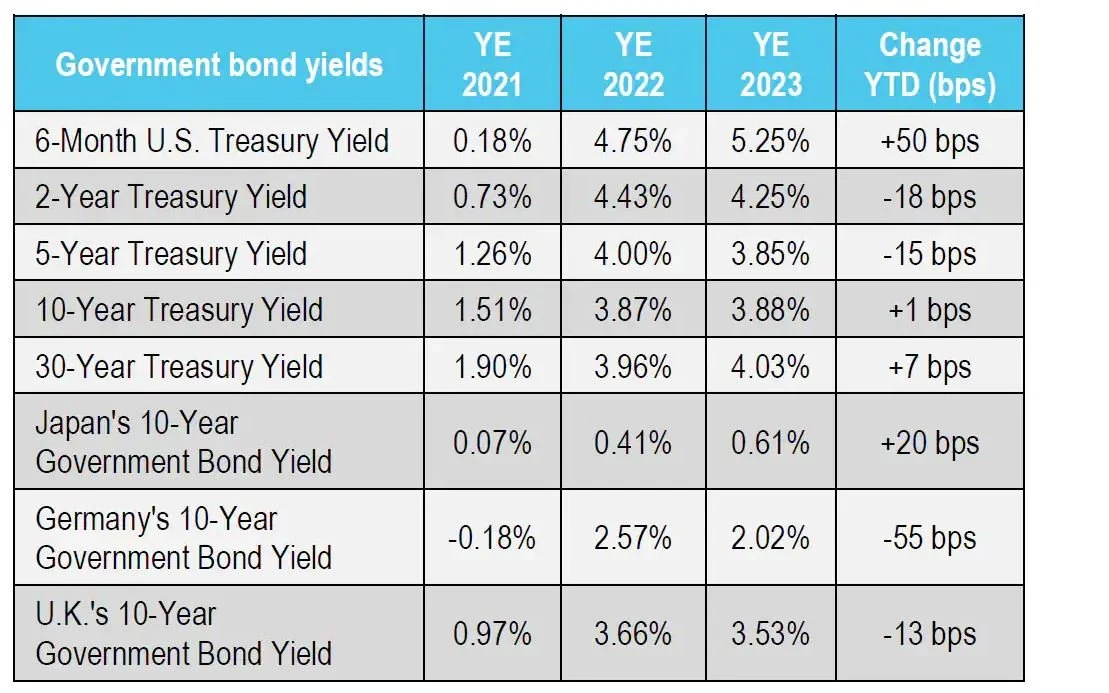
Source: Bloomberg as of Dec. 31, 2023
Magnificent 7 = UBS Magnificent 7 Index; NASDAQ = NASDAQ Index; Large Cap = S&P 500 Index; Japanese Equities = Nikkei 225 Index; European Equities = Stoxx 600 Index; Small Cap = Russell 2000 Index; US High Yield = Bloomberg US Corporate High Yield Total Return Index; Leveraged Loans = Bank of America Leveraged Loan Index; Gold = Gold Spot Price; EM Equities = MSCI Emerging Markets Index; EM Bonds = Bloomberg Emerging Markets Aggregate Bond Index; US IG = Bloomberg U.S. Aggregate Index; Treasury = Bloomberg US Treasury Total Return Index; Chinese Equities = Shanghai Shenzhen CSI 300 Index; Oil = Brent Crude Oil Spot Price.
____________________
Confidence grows that the Fed has actually nailed the “soft landing”
Fourth quarter market performance was the result of everything investors have been hoping for: declining inflation, stable growth, and most importantly, the Fed backing off its restrictive stance. The U.S. soft landing scenario is still intact, but we are not yet at “mission accomplished”. After the U.S. economy expanded 4.9 percent in the third quarter, the consensus estimate for fourth quarter at 1.2 percent growth is a slowdown, but not a contraction. Full year growth of 1.3 percent is expected for 2024 versus 2.4 percent for 2023. The consensus probability of near-term recession has dipped to 50 percent, while inflation continues to wither, and employment has held up.

Source: Bloomberg as of Dec. 31, 2023
______________________________
From a starting point of 6.5 percent inflation at the end of 2022 (and a peak of 9.1 percent in June 2022), are we in fact in a scenario of “immaculate disinflation”, or even potential deflation? We’ve made welcome progress towards the Fed’s goal of 2 percent. In November, the U.S. Consumer Price Index rose 3.1 percent and 4.0 percent year-over-year on the headline and core (excluding food and energy) measures, respectively. Per the Fed’s Summary of Economic Projections released in December, officials see core inflation falling to 3.2 percent in 2023 and 2.4 percent in 2024, then to 2.2 percent in 2025. Finally, it gets back to the 2 percent target in 2026. At the same time, the labor market continues to supply enough jobs for almost all who want them, although signs of loosening are materializing. The number of available jobs in the U.S. decreased to 8.8 million in November from 8.9 million in the prior month, the lowest level since early 2021.
Fourth quarter brings a friendlier Fed
At the December FOMC meeting, the Federal Reserve held its key interest rate steady for the third straight time and set the table for multiple cuts to come in 2024 and beyond. The market has taken care of some of the Fed’s work; the month of November saw the largest easing in U.S. financial conditions of any single month in the past four decades, equivalent to ~90 bps of interest rate cuts. In the words of Fed Governor Christopher Waller, it’s now time for officials to “wait, watch, and see” before acting on interest rates.
Source: Bloomberg as of Dec. 31, 2023
______________________
In 2024, inflation is projected to fall further. Because the Fed targets the level of real interest rates (nominal interest rate i.e., what we observe as interest rates quoted on bonds or loans minus the rate of inflation), to maintain the same level of restriction the Fed needs to cut the nominal rate in line with falling inflation. That has led the Fed to project three, 25-basis-point cuts in 2024. The market has priced a more ambitious pace, projecting approximately six cuts, or a 150-basis-point reduction in interest rates by the end of next year, double what the Fed is projecting. Beyond 2024, both the Fed and market foresee future rate cuts.

Source: Bloomberg as of Dec. 31, 2023
_________________________
Throughout the past several months, many warned of the risk that the Fed has “overtightened” or instituted policy that is too restrictive. Those concerns have thus far been alleviated by the resilience of the U.S. economy. Now, some are raising the possibility that the recent easing in financial conditions and strong market backdrop could reignite another wave of inflation or inhibit progress towards the Fed’s 2 percent target. As the past two years have shown, inflation, like the economy, has been incredibly difficult to forecast.
U.S. consumer chugging along despite some signs of exhaustion
The consumer is not in dire straits, but not without worry either. When staples like gasoline and groceries have cumulatively risen 43 percent and 20 percent, respectively, since January 2021, it should come as no surprise that shoppers are increasingly price sensitive. Consumers across all income levels have been seen trading down for lower-priced alternatives as they manage tighter budgets due to last year’s record inflation and interest rates. Per Bloomberg, the average consumer is spending $4,250 per month on mortgage payments, car, and student loans, combined. That is about two-thirds of median household income.
The U.S. personal-savings rate was just 3.8 percent in October, even as savers are incentivized by higher interest rates. These levels were last seen during the Great Recession and could be a signal that consumers are tapped out. The 65-year average is 8.5 percent and the all-time low was 1.8 percent in 2005, per Bloomberg data. At the same time, Americans are racking up credit-card debt as inflation pressures consumer budgets, a sign that current spending levels for select income cohorts could be unsustainable. The Federal Reserve Bank of New York calculated total credit card balances as having jumped 16.6 percent to a record $1.08 trillion in the third quarter. Furthermore, the percent of U.S. credit card accounts that are 90 or more days delinquent has almost doubled since the first quarter of 2022 and is now above the pre-pandemic level and 15-year average.

Source: Bloomberg as of Dec. 31, 2023
_________________________
A key question is whether current trends are simply a normalization as we adjust back to a world of non-zero interest rates and reduced government support, or the beginnings of a broader deterioration. We believe the answer lies in the future performance of the labor market; so long as the labor market remains stable and unemployment relatively low, the consumer should continue to chug along as well.
Tech turbocharges 2023 U.S. equity market returns
According to Goldman Sachs, the NASDAQ 100 Index has risen in 14 of the past 15 years for a post-2008 cumulative gain of 1,517 percent! 2023 was no exception as the largest seven U.S. technology companies surged by 76 percent compared to the S&P 493’s 12 percent. As a result of the huge gains seen across a narrow basket of stocks that included a 239 percent return in NVIDIA shares and 194 percent gain in META, equity concentration in the S&P 500 is now at levels not seen since the 1970s.

Source: Bloomberg as of Dec. 31, 2023
Higher interest rates have been a fundamental boost for mega tech companies with billions of dollars in cash on their balance sheets. Net interest payments paid by corporations have fallen to 40-year lows thanks to earnings on short-term investments and businesses locking in ultra-low interest rates on debt when they had the opportunity. Meanwhile small and medium-size businesses that tend to have floating rate debt are under pressure with higher interest expenses, hiring slowing, and credit card balances rising.
Zooming out on the U.S. equity market, many investors are asking: was the ferocious fourth quarter rally overdone? Equities are not exactly cheap. According to Apollo, investors buying the S&P 500 today are buying seven companies that were up approximately 80 percent in 2023 and have an average P/E ratio above 50. Earnings growth has turned positive despite sticky and top-line price inflation fading. After growing by a meager 0.6 percent in 2023, the consensus expects S&P 500 earnings per share to rebound sharply, growing 11 percent in 2024 despite a slowing economy.
Looking ahead
For 2024, consensus expects ideal market and economic conditions to persist. Inflation and interest rates are projected to decline while economic growth slows but remains positive enough to drive double digit corporate earnings growth. Expectations for Fed easing are nearly double what the Fed itself is projecting for 2024. As we saw with 2023, interest rate, inflation, and economic growth projections significantly missed the mark and are very difficult to project accurately.
Therefore, as we look ahead to 2024, we are thinking about risks and alternatives to the consensus view:
What if the economy remains resilient, growth continues to surprise to the upside, inflation rebounds or stalls, and the Fed must maintain restrictive policy for longer than anticipated?
Alternatively, what if the much-anticipated recession finally arrives, leading to weakness in corporate earnings and risk assets?
Could increased Treasury issuance due to soaring U.S. debt levels put renewed pressure on long-term interest rates?
Will markets continue to remain largely immune to geopolitical shocks and risks?
If 2023 taught us anything, it is to expect the unexpected and that market and economic projections, especially over relatively short timeframes, are usually wrong. We wish you a happy 2024 and encourage you to speak with a financial professional in navigating this complex backdrop.
_____________________________________
Market Indices have been provided for informational purposes only; they are unmanaged and reflect no fees or expenses. Individuals cannot invest directly in an index.
Description
The UBS Magnificent 7 Index tracks a group of 7 of the largest mega cap tech stocks listed in the US. The stocks mirror their respective S&P 500 weight reweighted pro-rata.
The NASDAQ Composite Index is a broad-based capitalization-weighted index of stocks in all three NASDAQ tiers: Global Select, Global Market and Capital Market.
The S&P 500 Index is widely regarded as the best single gauge of large-cap U.S. equities and serves as the foundation for a wide range of investment products. The index includes 500 leading companies and captures approximately 80 percent coverage of available market capitalization.
The Nikkei-225 Stock Average is a price-weighted average of 225 top-rated Japanese companies listed in the First Section of the Tokyo Stock Exchange. The Nikkei Stock Average was first published on May 16, 1949, where the average price was ¥176.21 with a divisor of 225.
The STOXX Europe 600 Index is derived from the STOXX Europe Total Market Index (TMI) and is a subset of the STOXX Global 1800 Index. With a fixed number of 600 components, the STOXX Europe 600 Index represents large, mid and small capitalization companies across 17 countries of the European region.
The Russell 2000 Index is comprised of the smallest 2000 companies in the Russell 3000 Index, representing approximately 8 percent of the Russell 3000 total market capitalization. The real-time value is calculated with a base value of 135.00 as of December 31, 1986. The end-of-day value is calculated with a base value of 100.00 as of December 29, 1978.
The Bloomberg US Corporate High Yield Bond Index measures the USD-denominated, high yield, fixed-rate corporate bond market. Securities are classified as high yield if the middle rating of Moody's, Fitch and S&P is Ba1/BB+/BB+ or below. Bonds from issuers with an emerging markets country of risk, based on Bloomberg EM country definition, are excluded
The Bank of America Leveraged Loan Index is designed to measure the performance of the 100 largest facilities in the US leveraged loan market. Index constituents are market-value weighted, subject to a single loan facility weight cap of 2 percent.
Gold Spot Price is quoted as dollars per Troy Ounce.
The MSCI EM (Emerging Markets) Index is a free-float weighted equity index that captures large and mid cap representation across Emerging Markets (EM) countries. The index covers approximately 85 percent of the free float-adjusted market capitalization in each country.
Standard and Poor's Midcap 400 Index is a capitalization-weighted index which measures the performance of the mid-range sector of the U.S. stock market. The index was developed with a base level of 100 as of December 31, 1990.
The Bloomberg Emerging Markets Hard Currency Aggregate Index is a flagship hard currency Emerging Markets debt benchmark that includes USD-denominated debt from sovereign, quasi-sovereign, and corporate EM issuers.
The Bloomberg USAgg Index is a broad-based flagship benchmark that measures the investment grade, US dollar-denominated, fixed-rate taxable bond market. The index includes Treasuries, government-related and corporate securities, MBS (agency fixed-rate pass-throughs), ABS and CMBS (agency and non-agency).
The Bloomberg US Treasury Index measures US dollar-denominated, fixed-rate, nominal debt issued by the US Treasury. Treasury bills are excluded by the maturity constraint, but are part of a separate Short Treasury Index. STRIPS are excluded from the index because their inclusion would result in double-counting.
The CSI 300 Index is a free-float weighted index that consists of 300 A-share stocks listed on the Shanghai or Shenzhen Stock Exchanges. Index has a base level of 1000 on 12/31/2004. * Due to our agreement with CSI, shares in the index is restricted, please visit SSIS<go> for more information and access. This ticker holds prices fed from Shenzhen Stock Exchange.
Oil Spot Price is quoted as dollars per barrel for export quality Brent crude oil.
Past performance is no guarantee of future performance or market conditions. Investing involves risk including the possible loss of principal. Investment return and principal value will fluctuate so that when sold may be worth more or less than the original cost.
Use of political figures or statements is solely for reference and relevance to financial markets and is not meant to be an endorsement or a reflection of the company’s opinion or position.
This material is intended for informational purposes only and does not constitute a recommendation to engage in or refrain from a particular course of action. The information within has not been tailored for any individual and is not intended as tax, legal or investment advice.
The views and opinions expressed are those of the author as of the date of the writing and are subject to change without notice. Although the information has been gathered from sources believed to be reliable, it is not guaranteed. Please note that individual situations can vary, therefore, the information should be relied upon when coordinated with individual professional advice. Clients must rely upon his or her own financial professional before making decisions with respect to these matters.
This communication may include forward-looking statements or projections that are subject to certain risks and uncertainties. Actual results, performance, or achievements may differ materially from those expressed or implied.
Investments discussed may have been held in client accounts as of June 30, 2023. These investments may or may not be currently held in client accounts.
The information provided is not written or intended as specific tax or legal advice. Vault Financial, its employees and representatives are not authorized to give tax or legal advice. You are encouraged to seek advice from your own tax or legal counsel. Opinions expressed by those interviewed are their own and do not necessarily represent the views of Vault Financial or Massachusetts Mutual Life Insurance Company.
Provided by Jeffrey Albin, a financial representative with Vault Financial, courtesy of Massachusetts Mutual Life Insurance Company (MassMutual).
©2023 Massachusetts Mutual Life Insurance Company, Springfield, MA 01111-0001 MM202701-307824